
Newsletter Subscribe
Enter your email address below and subscribe to our newsletter
Enter your email address below and subscribe to our newsletter
Daily Vector
Daily Vector

 Have you ever been so convinced that a market was about to breakout to a new high or low that you truly felt like it was a ‘sure bet’, only to then see price briefly breakout and then rocket back in the opposite direction?
Whilst you cannot predict the market’s behavior with 100% accuracy, you can change the way you think about it and learn to interpret it better, so that you begin to trade less like the ‘herd’ and more like a contrarian.
To be more specific, I am primarily talking about false-breaks and how they catch traders on the wrong side of the market. You may buy a breakout that looks like a ‘sure bet’ to you, exposing yourself to the market, then if you get caught in one of these false breakouts, you must cover back your position, you and many, many other traders as well. This works to fuel the subsequent move in the opposite direction that stops you out for a loss. This is where the expressions “caught long” or “caught short” came from, as well as what is known as a “squeeze”; as the breakout unravels, traders who bought or sold into it get caught on the wrong side of the market and get squeezed out of their positions.
If you’re tired of feeling like you are just another trader stuck in the herd of those who lose money and continuously get caught on the wrong side of the market, it’s time to do something about it, time to make a change…
Here is what you need to remember: The markets are designed to fake you out and do the opposite of what they sometimes look like they should or might do. For an amateur trader or for someone who hasn’t yet learned how to read the charts or think about them properly, it can often seem like you’re getting ‘tricked’ by the market or as if someone is playing a cruel game with you.
“Just as a scenario writer endeavors to mystify his audience, so pools and manipulators strive to confuse and influence the public into thinking a stock is moving in a certain direction when the ultimate purpose is to have it move the other way.” – Richard Wyckoff
However, if you understand the mentality of a contrarian trader, and what that means, you will begin to see the markets in a different light. A contrarian trader isn’t only looking for trading opportunities that meet his or her plan, they are also thinking about what the ‘herd’ is thinking and likely to do, and they use this as another piece of confluence or supporting factor to take a position or not.
Unfortunately for the uneducated traders out there, breakouts are ‘prime rib’ for experienced traders who know what they’re doing and know how the uneducated think. Experienced, contrarian traders are like patient snipers, waiting to pick-off the enemy when the confluence of events come together and the chart looks ripe for the picking.
You see, professional traders are looking to take advantage of the herd, just as a pack of lions tries to find the weakness in a herd of zebras. This is where terms like “fading strength” or “fading weakness” come from, or “selling into strength” or “buying into weakness”. Essentially, professionals know that markets ebb and flow and that they are much more likely to retrace and revert to the mean than they are to carry on in a straight line for a long period. Beginning and unsuccessful traders tend to think the opposite; they will buy when prices are near the top or sell when near the low, only to get caught on the wrong side of the market as prices inevitably retrace back the opposite way.
Professionals look to take advantage of this by looking to fade or (trade against) strength in a market that is trending lower overall, or fade weakness in a market that is rising overall. The losing traders are only paying attention to what price is doing ‘right now’, disregarding the overall market context and what the implications of that are.
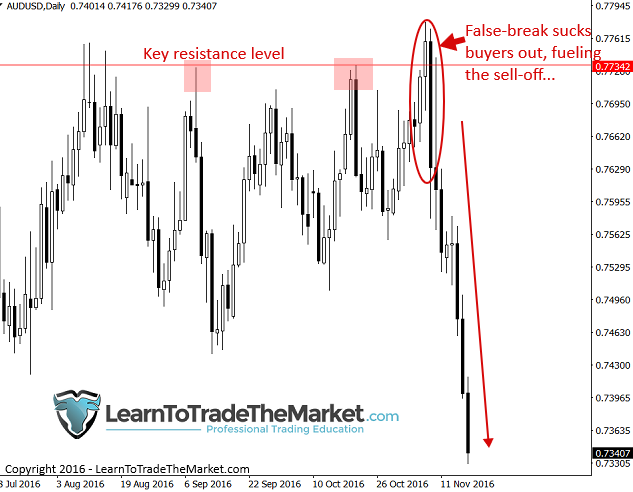
Let’s look at an example to clarify all of this. The concept we are demonstrating on the chart below is that of a market that for all intents and purposes, looks like it will almost certainly break higher, this works to lure all the armature traders in, setting them up to be exposed just before prices reverse.
In the AUDUSD chart below, the market was building momentum just below key resistance near 0.7735 area, looking like it would almost certainly breakout to the upside. However, what really happened was that price briefly broke higher and sucked up all those buy orders, only to reverse lower, stopping everyone out, forcing them to cover their positions which fueled the sell-off.
Now, I know what some of you are likely thinking, so let’s discuss this further…
You weren’t necessarily a ‘bad trader’ if you bought the breakout, but what would make you a bad trader is if you had no plan in place to contain your losses should prices reverse lower, as they did. Many traders become SO convinced that a breakout will work that they load up on the position, risking more than they should, and sometimes don’t even use a stop loss, which clearly is a setup to blow out their accounts.
If you were long on that breakout, the correct thing to do would have been to see it was failing and exit your position. Then, take a deep breath and wait to see what happened into the day’s close. You will notice that after the huge false-break follow-through, price retraced all the way back up to that 0.7735 resistance level, providing for a great second-chance entry opportunity to get short and ride the subsequent move down. You see, it’s all about reading the chart and making a plan to take advantage of it.
You see understanding false breakouts helps you to both think like a contrarian (opposite of the herd) but also how to read the chart from left to right. Trading is about reading charts and price action, not necessarily trading things instantly as they’re happening. We need a defined set of conditions to find a trade; For example: “Okay, this false-break just happened, now how can I take advantage of it”?
False breakouts are a cornerstone of any market, and they happen in every market. As price action traders, we need to learn to read the foot prints on the chart. This means false breakouts like bull and bear traps or long bar tails or wicks at new highs or lows; these are foot prints of the bigger players trying to tell us something.
You must anticipate false breakouts to some degree, I am not saying you should try and trade them as they happen, I am saying before you enter a new position stop and think if you are potentially getting sucked into a false breakout yourself. Be on the alert for false breaks as you may often miss them because they happen often and quickly.
Let’s look at the GBPJPY and a recent false break that occurred on that chart.
The Sterling/yen pushed down through 129.50 support and then consolidated for several weeks before pushing back up through that level, trapping everyone short. This is a perfect example of the market luring in positions and then squeezing people out of their short positions as we reconnected higher.
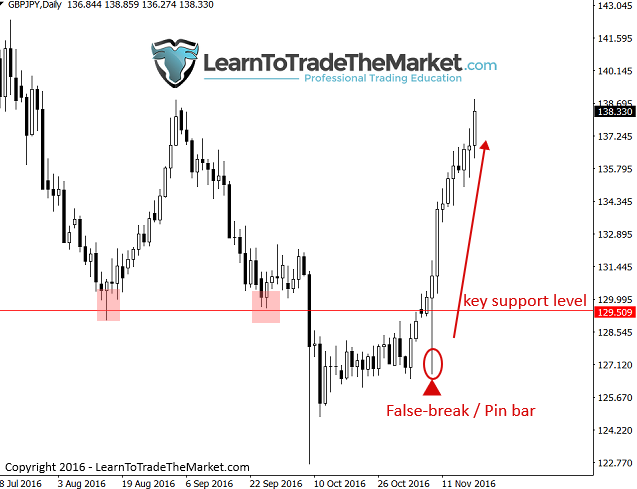
If you follow price action, one of the signals we teach would have got you in here (the pin bar). Note that we are not necessarily trading the false-break as it happened. However, had you waited until after it happened, we got a signal. That pin bar signal tells us what we can likely expect next (higher prices) and gives us a plan of action (get long on any temporary weakness). This is how you read the chart and price action and then trade accordingly.
One side note I want to touch on before we conclude today’s lesson: You may be wondering how my fakey setup fits in with false breakouts. Well, a fakey is essentially a ‘compressed’ version of the false-break concept. By that I mean, it doesn’t necessarily occur at highs or lows, but it can occur within a trend or basically anywhere on the chart. The fakey is a contrarian signal itself, it occurs when we get a false-break from an inside bar signal; price initially breaks one way from the inside bar but then reverses, trapping everyone on the wrong side of the breakout, creating the false-break and usually a subsequent move the opposite direction.
The price action strategies and patterns discussed in today’s lesson form the backbone of my trading strategies arsenal and are responsible for most trades I take. You can learn much more about these advanced price action signals, including false breaks and my proprietary fakey pattern, in my price action trading course.
The post Trade Like a Contrarian, Do the Opposite of The Herd first appeared on Learn To Trade The Market.